
在 Spring Boot 中配置 OpenTelemetry
1、概览
在本教程中,我们将学习如何在 Spring Boot 应用中整合 OpenTelemetry 。以及如何配置 OpenTelemetry 来追踪请求链路,并将其发送到中央系统以监控请求。
2、OpenTelemetry 简介
OpenTelemetry(Otel)是一组标准化的工具(与供应商无关)、API 和 SDK。它是一个 CNCF 孵化项目,是 OpenTracing 和 OpenCensus 项目的合并产物。
OpenTracing 用于向可观测性后端发送 telemetry(遥测)数据。OpenCensus 项目提供了一套特定于语言的库,开发人员可以用它来检测自己的代码,并将其发送到任何受支持的后端。Otel 使用与其前身项目相同的 trace 和 span 概念来表示微服务间的请求链路。
OpenTelemetry 允许我们检测、生成和收集 telemetry 数据,这有助于分析应用程序的行为或性能。telemetry 数据包括日志、指标和链路跟踪。
使用 Otel SDK,我们可以轻松地覆盖或添加更多属性到链路跟踪中。
让我们通过一个例子来深入了解一下。
3、示例应用
假设我们需要构建两个微服务,其中一个服务与另一个服务交互。
3.1、Maven 依赖
首先,我们将创建 Spring Boot Web 项目,并在两个应用中包含以下 Spring 和 OpenTelemetry 依赖项:
spring-cloud-starter-sleuth、spring-cloud-sleuth-otel-autoconfigure 和 opentelemetry-exporter-otlp 将自动捕获链路跟踪并导出到任何支持的 collector。
<dependency>
    <groupId>org.springframework.boot</groupId>
    <artifactId>spring-boot-starter-web</artifactId>
</dependency>
<dependency>
    <groupId>org.springframework.cloud</groupId>
    <artifactId>spring-cloud-starter-sleuth</artifactId>
    <exclusions>
        <exclusion>
            <groupId>org.springframework.cloud</groupId>
            <artifactId>spring-cloud-sleuth-brave</artifactId>
        </exclusion>
   </exclusions>
</dependency>
<dependency>
    <groupId>org.springframework.cloud</groupId>
    <artifactId>spring-cloud-sleuth-otel-autoconfigure</artifactId>
</dependency>
<dependency>
    <groupId>io.opentelemetry</groupId>
    <artifactId>opentelemetry-exporter-otlp</artifactId>
    <version>1.23.1</version>
</dependency>
注意,我们排除了 Spring Cloud Brave 依赖,以替换默认的追踪实现为 OpenTelemetry。
此外,我们需要包含 Spring Dependency Management BOM 来管理 Spring Cloud Sleuth 的依赖版本。
<dependencyManagement>
    <dependencies>
        <dependency>
            <groupId>org.springframework.cloud</groupId>
            <artifactId>spring-cloud-dependencies</artifactId>
            <version>2021.0.5</version>
            <type>pom</type>
            <scope>import</scope>
        </dependency>
        <dependency>
            <groupId>org.springframework.cloud</groupId>
            <artifactId>spring-cloud-sleuth-otel-dependencies</artifactId>
            <version>1.1.2</version>
            <scope>import</scope>
            <type>pom</type>
        </dependency>
    </dependencies>
</dependencyManagement>
3.2、实现下游应用
我们的下游应用有一个端点来返回价格数据。
首先,为 Price 类建模:
public class Price {
    private long productId;
    private double priceAmount;
    private double discount;
}
接下来,实现获取价格的端点 PriceController:
@RestController(value = "/price")
public class PriceController {

    private static final Logger LOGGER = LoggerFactory.getLogger(PriceController.class);

    @Autowired
    private PriceRepository priceRepository;

    @GetMapping(path = "/{id}")
    public Price getPrice(@PathVariable("id") long productId) {
        LOGGER.info("Getting Price details for Product Id {}", productId);
        return priceRepository.getPrice(productId);
    }
}
然后,在 PriceRepository 中实现 getPrice 方法:
public Price getPrice(Long productId){
    LOGGER.info("Getting Price from Price Repo With Product Id {}", productId);
    if(!priceMap.containsKey(productId)){
        LOGGER.error("Price Not Found for Product Id {}", productId);
        throw new PriceNotFoundException("Price Not Found");
    }
    return priceMap.get(productId);
}
3.3、实现上游应用
上游应用有一个获取 Product 详细信息的端点,并与上述获 “取价格端点” 通信。
首先,让我们实现 Product 类:
public class Product {
    private long id;
    private String name;
    private Price price;
}
然后,让我们实现 ProductController 类,并为其添加一个用于获取产品的端点:
@RestController
public class ProductController {

    private static final Logger LOGGER = LoggerFactory.getLogger(ProductController.class);

    @Autowired
    private PriceClient priceClient;

    @Autowired
    private ProductRepository productRepository;

    @GetMapping(path = "/product/{id}")
    public Product getProductDetails(@PathVariable("id") long productId){
        LOGGER.info("Getting Product and Price Details with Product Id {}", productId);
        Product product = productRepository.getProduct(productId);
        product.setPrice(priceClient.getPrice(productId));
        return product;
    }
}
接下来,在 ProductRepository 中实现 getProduct 方法:
public Product getProduct(Long productId){
    LOGGER.info("Getting Product from Product Repo With Product Id {}", productId);
    if(!productMap.containsKey(productId)){
        LOGGER.error("Product Not Found for Product Id {}", productId);
        throw new ProductNotFoundException("Product Not Found");
    }
    return productMap.get(productId);
}
最后,在 PriceClient 中实现 getPrice 方法:
public Price getPrice(@PathVariable("id") long productId){
    LOGGER.info("Fetching Price Details With Product Id {}", productId);
    String url = String.format("%s/price/%d", baseUrl, productId);
    ResponseEntity<Price> price = restTemplate.getForEntity(url, Price.class);
    return price.getBody();
}
4、在 Spring Boot 中配置 OpenTelemetry
OpenTelemetry 提供了一种称为 Otel collector 的 collector,用于处理 telemetry 数据并将其导出到任何可观察性后端,如 Jaeger、Prometheus 等。
使用一些简单 Spring Sleuth 配置,就能将链路追踪导出到 Otel collector。
4.1、配置 Spring Sleuth
在 application.properties 中加入 Spring Sleuth 配置:
spring.sleuth.otel.config.trace-id-ratio-based=1.0
spring.sleuth.otel.exporter.otlp.endpoint=http://collector:4317
trace-id-ratio-based 属性定义了收集 span 的采样率。数值 1.0 表示将导出所有 span。
4.2、配置 OpenTelemetry Collector
Otel collector 是 OpenTelemetry 链路追踪的引擎。它由 receiver、processor 和 exporter 组件组成。还有一个可选的扩展组件,可帮助进行健康检查、服务发现或数据转发。扩展组件不涉及 telemetry 数据的处理。
为了快速启动 Otel 服务,我们将使用监听 14250 端口的 Jaeger 后端端点。
在 otel-config.yml 中配置 Otel pipeline stage:
receivers:
  otlp:
    protocols:
      grpc:
      http:

processors:
  batch:

exporters:
  logging:
    loglevel: debug
  jaeger:
    endpoint: jaeger-service:14250
    tls:
      insecure: true

service:
  pipelines:
    traces:
      receivers:  [ otlp ]
      processors: [ batch ]
      exporters:  [ logging, jaeger ]
注意,上述 rocessors 配置为可选配置,默认情况下不启用。processors batch 选项有助于更好地压缩数据,减少传输数据所需的外发连接数。
此外,receiver 配置了 GRPC 和 HTTP 协议。
5、运行应用
现在,我们将配置并运行整个设置、应用程序和 Otel collector。
5.1、在应用中配置 Dockerfile
为 Product Service 实现 Dockerfile。
FROM adoptopenjdk/openjdk11:alpine
 target/spring-cloud-open-telemetry1-1.0.0-SNAPSHOT.jar spring-cloud-open-telemetry.jar
EXPOSE 8080
ENTRYPOINT ["java","-jar","/spring-cloud-open-telemetry.jar"]
Price Service 的 Dockerfile 基本相同。
5.2、使用 Docker Compose 配置服务
现在,让我们把整个设置配置到 docker-compose.yml:
version: "4.0"

services:
  product-service:
    build: spring-cloud-open-telemetry1/
    ports:
      - "8080:8080"

  price-service:
    build: spring-cloud-open-telemetry2/
    ports:
      - "8081"

  collector:
    image: otel/opentelemetry-collector:0.72.0
    command: [ "--config=/etc/otel-collector-config.yml" ]
    volumes:
      - ./otel-config.yml:/etc/otel-collector-config.yml
    ports:
      - "4317:4317"
    depends_on:
      - jaeger-service

  jaeger-service:
    image: jaegertracing/all-in-one:latest
    ports:
      - "16686:16686"
      - "14250"
现在,通过 docker-compose 运行这些服务:
$ docker-compose up
5.3、验证正在运行的 Docker 服务
除了 product-service 和 price-service,我们还在整个设置中添加了 collector-service 和 jaeger-service。collector 服务反过来依靠 jaeger-service 端点将链路跟踪数据导出到 Jaeger 后端。
对于 jaeger-service,我们使用的是 jaegertracing/all-in-one 镜像,其中包括后台和 UI 组件。
使用 docker container 命令来验证服务的状态:
$ docker container ls --format "table {{.ID}}\t{{.Names}}\t{{.Status}}\t{{.Ports}}"
CONTAINER ID   NAMES                                           STATUS         PORTS
7b874b9ee2e6   spring-cloud-open-telemetry-collector-1         Up 5 minutes   0.0.0.0:4317->4317/tcp, 55678-55679/tcp
29ed09779f98   spring-cloud-open-telemetry-jaeger-service-1    Up 5 minutes   5775/udp, 5778/tcp, 6831-6832/udp, 14268/tcp, 0.0.0.0:16686->16686/tcp, 0.0.0.0:61686->14250/tcp
75bfbf6d3551   spring-cloud-open-telemetry-product-service-1   Up 5 minutes   0.0.0.0:8080->8080/tcp, 8081/tcp
d2ca1457b5ab   spring-cloud-open-telemetry-price-service-1     Up 5 minutes   0.0.0.0:61687->8081/tcp
6、监控 Collector 中的链路追踪
像 Jaeger 这样的 telemetry collector 工具提供了前端应用来监控请求。我们可以实时或稍后查看请求的链路跟踪。
让我们在请求成功和失败时监控这些追踪。
6.1、请求成功时监控链路追踪
首先,调用 Product 端点 http://localhost:8080/product/100003。
该请求将显示一些日志:
spring-cloud-open-telemetry-price-service-1 | 2023-01-06 19:03:03.985 INFO [price-service,825dad4a4a308e6f7c97171daf29041a,346a0590f545bbcf] 1 --- [nio-8081-exec-1] c.b.opentelemetry.PriceRepository : Getting Price from Price With Product Id 100003
spring-cloud-open-telemetry-product-service-1 | 2023-01-06 19:03:04.432 INFO [,825dad4a4a308e6f7c97171daf29041a,fb9c54565b028eb8] 1 --- [nio-8080-exec-1] c.b.opentelemetry.ProductRepository : Getting Product from Product Repo With Product Id 100003
spring-cloud-open-telemetry-collector-1 | Trace ID : 825dad4a4a308e6f7c97171daf29041a
Spring Sleuth 会自动配置 ProductService,将链路 trace id 附加到当前线程,并作为 HTTP Header 附加到下游 API 调用。PriceService 也会自动在线程上下文和日志中包含相同的 trace id。Otel service 将使用此 trace id 来确定跨服务的请求链路。
不出所料,上述 Trace id ... f29041a 在 PriceService 和 ProductService 日志中都是一样的。
让我们在 Jaeger UI (16686 端口)中查看整个请求跨度时间线:
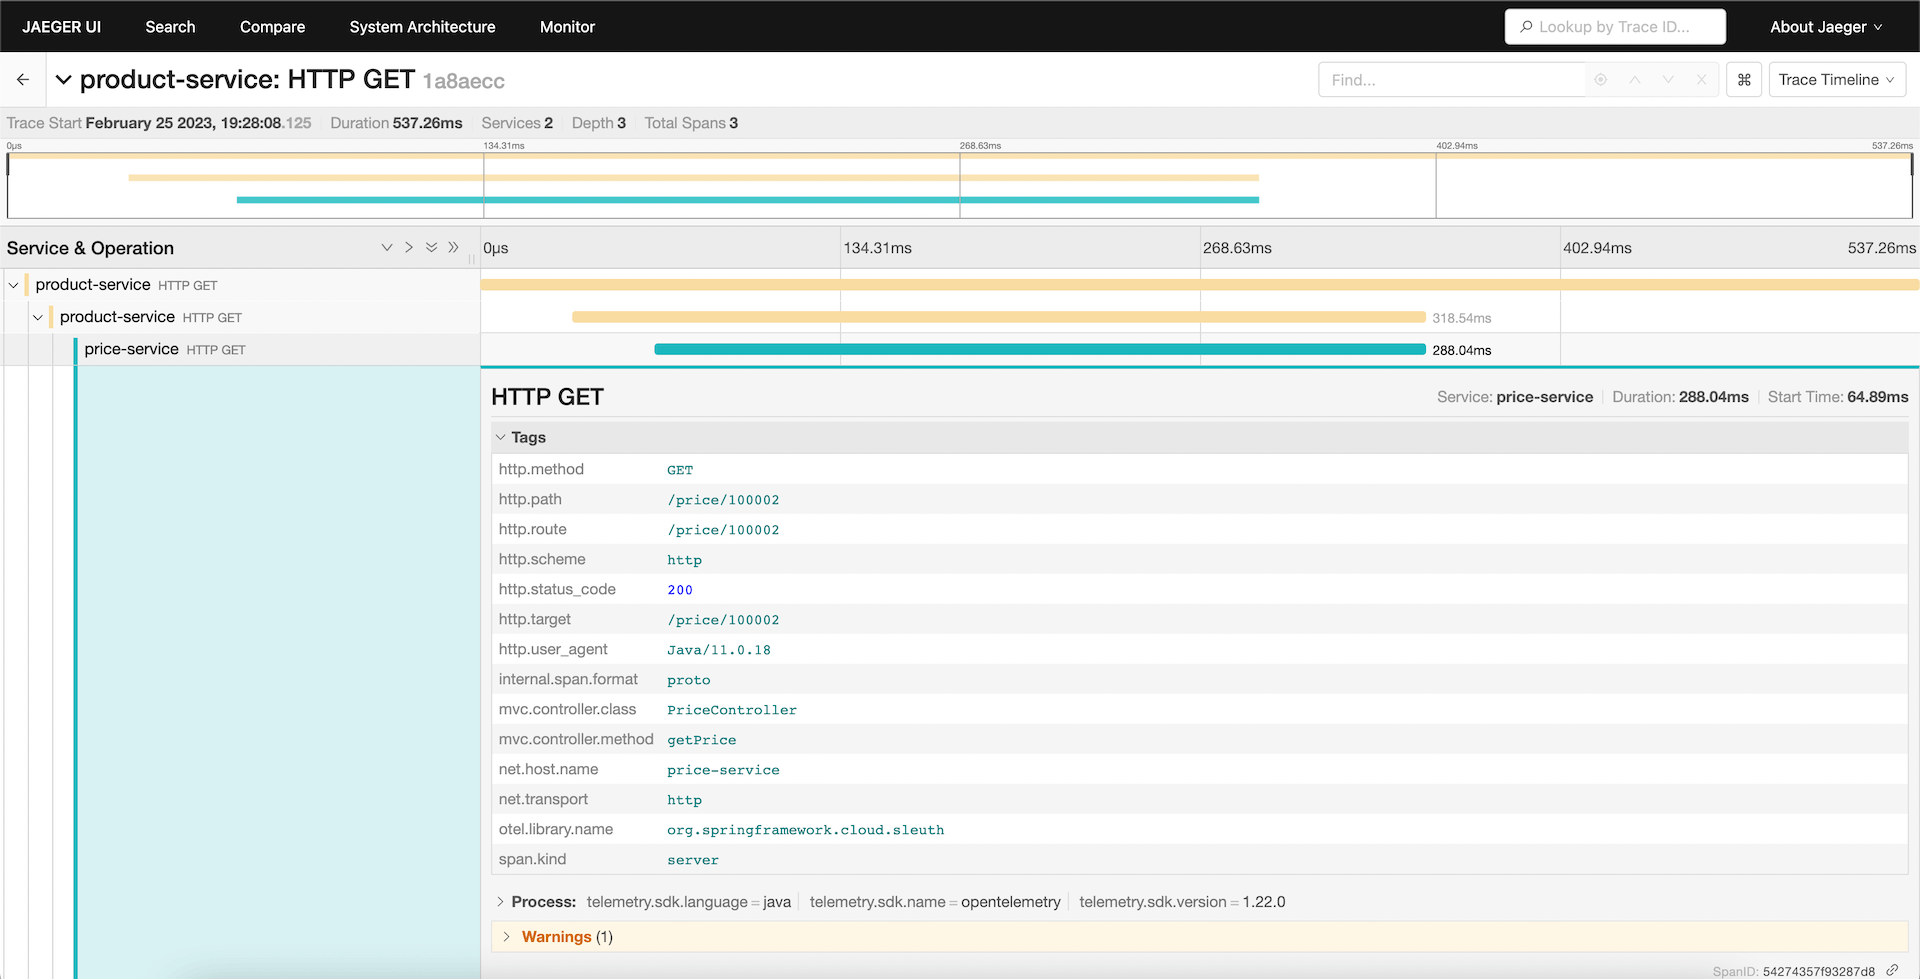
上图显示了请求链的时间线,并包含表示请求的元数据。
6.2、请求失败时监控链路追踪
假设下游服务抛出异常,导致请求失败。我们再次使用相同的 UI 来分析根本原因。
让我们调用 Product 端点 /product/100005 调用来测试上述情况,此时下游应用中不存在此 Product。
现在,让我们查看失败的请求跨度:
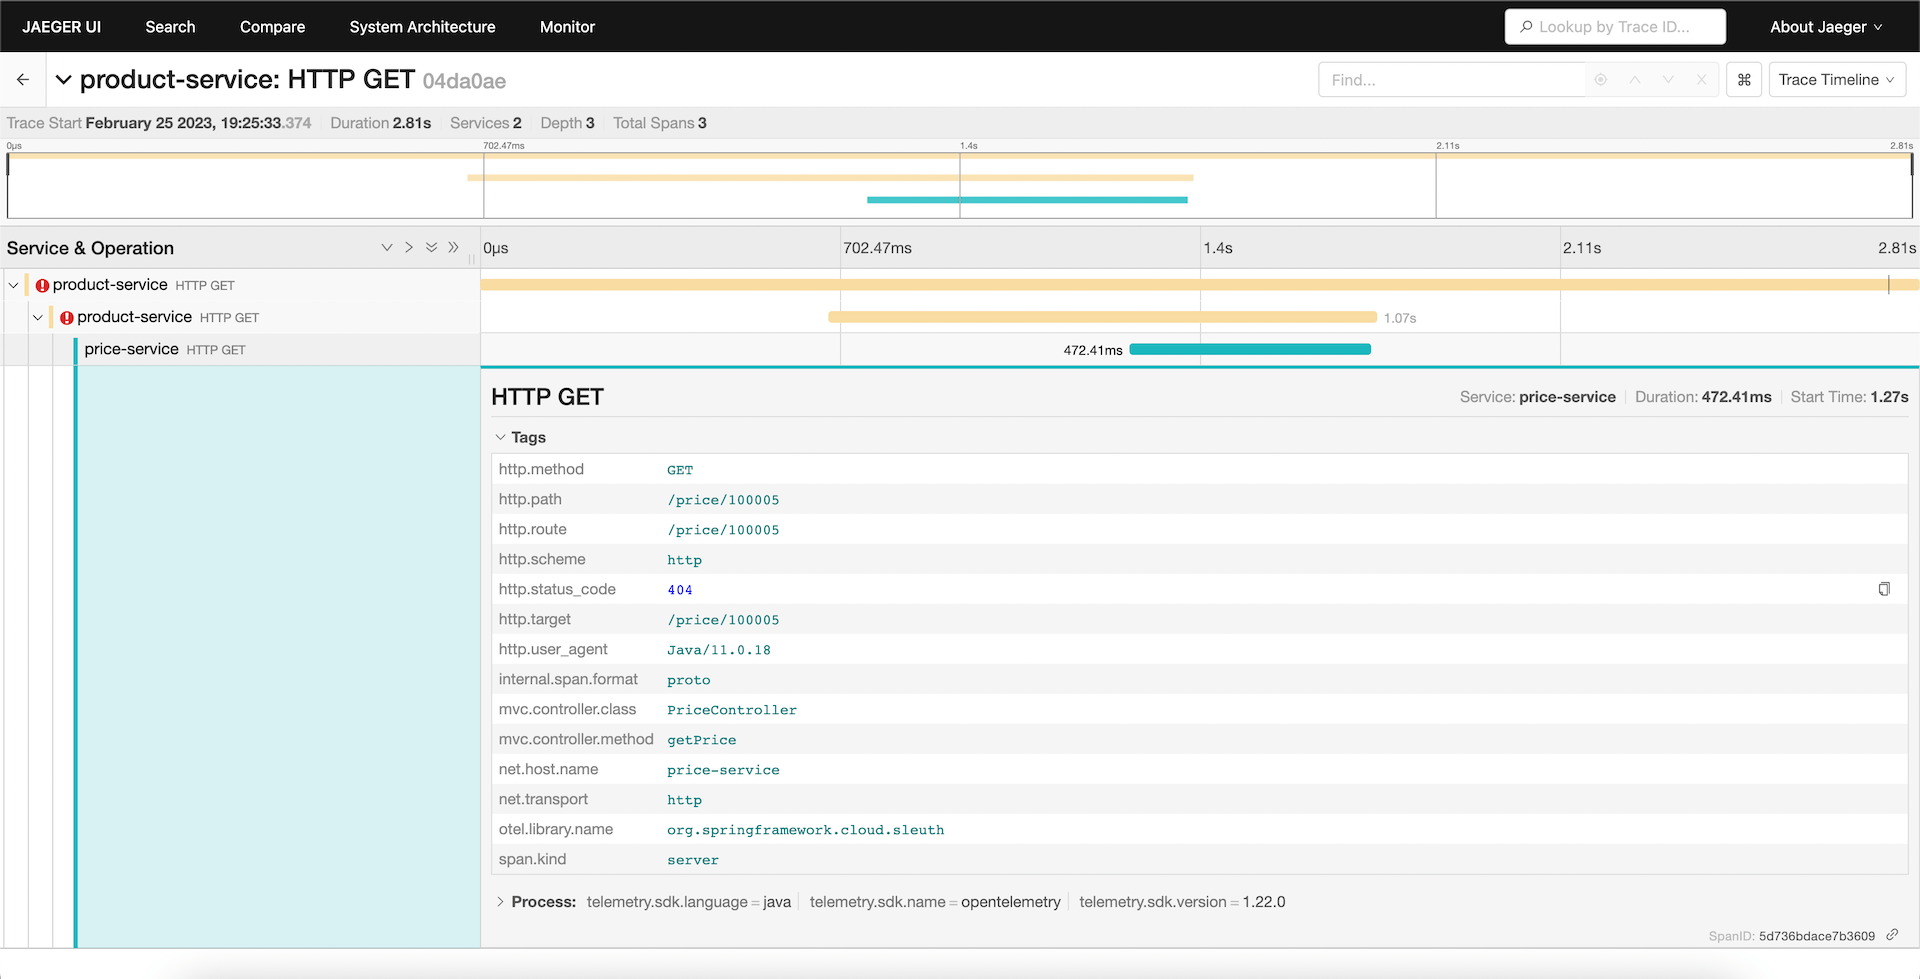
如上图所示,我们可以追溯到请求的最后一次 API 调用,错误就发生在这里。
7、总结
在本文中,我们了解了 OpenTelemetry 如何帮助微服务实现可观察性模式的标准化。
我们还通过一个示例了解了如何在 Spring Boot 应用中整合 OpenTelemetry,以及如何配置 OpenTelemetry 来追踪请求链路。
参考:https://www.baeldung.com/spring-boot-opentelemetry-setup