Spring Boot 3 整合 Spring Cloud 开发微服务应用
Spring Boot 3.0 已于 2022 年 11 月底全面 发布。本文将教你如何使用 Spring Boot 3 和 Spring Cloud 组件构建微服务。
总的来说,本文将涉及以下主题:
- 在云原生开发中使用 Spring Boot 3。
- 使用 Spring Cloud Netflix Eureka 为所有微服务提供服务发现功能。你可能想说 “在还用 Eureka?” - 是的,Eureka 还在。它是 Spring Cloud 中最后一个可用的 Netflix 微服务组件。
- 使用 Spring Cloud OpenFeign 进行服务间通信。
- 使用 Spring Cloud Config 作为分布式配置中心。
- 使用 Spring Cloud Gateway 作为网关,其中包括使用 Springdoc 项目创建全局 OpenAPI 文档。
- 使用 Micrometer OpenTelemetry 和 Zipkin 采集链路追踪。
从 Spring Boot 2 迁移到 Spring Boot 3 并不是太麻烦,具体变更的细节和迁移方法可以参考 这篇文章。
运行环境
目前,运行 Spring Boot 微服务的首选平台是 Kubernetes。
Kubernetes 有许多有用的工具和平台服务可以轻松集成到应用程序中。第一时间可以想到的是 Kubernetes 原生的解决方案,如 service mesh(例如 Istio)或 serverless(例如 Knative)。这里的主要问题是:如果我在 Kubernetes 上运行微服务,Spring Cloud 组件是否仍然推荐使用?答案是:在大多数情况下,不再推荐。当然,你仍然可以使用 Eureka 进行服务发现,使用 Spring Cloud Config 进行分布式配置,或者使用 Spring Cloud Gateway 实现 API 网关。然而,你可以轻松地用 Kubernetes 内置的机制和其他平台服务替代它们。
源码
你可以自己进行尝试,克隆我的 GitHub 仓库 获取源码,按照我的说明操作即可。
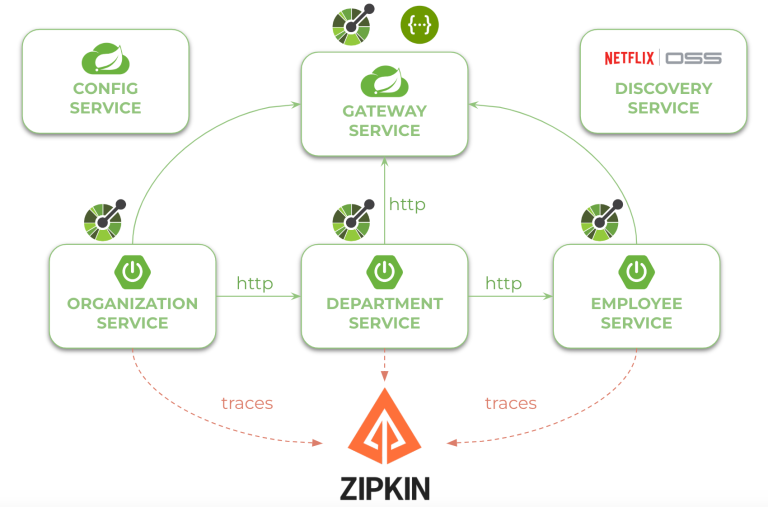
在开始学习源代码之前,我们先来看看下图。它展示了我们示例系统的架构。我们有三个独立的 Spring Boot 3 微服务,它们在服务发现中注册自己,从配置服务中获取属性,并相互通信。整个系统隐藏在 API 网关后面。我们的 Spring Boot 3 微服务使用 Micrometer OTEL 项目向 Zipkin 实例发送链路追踪信息。
目前,Spring Cloud 的最新版本是 2022.0.1。将此版本的 spring-cloud-dependencies 声明为 BOM,以便进行依赖管理。
<dependencyManagement>
  <dependencies>
    <dependency>
      <groupId>org.springframework.cloud</groupId>
      <artifactId>spring-cloud-dependencies</artifactId>
      <version>2022.0.1</version>
      <type>pom</type>
      <scope>import</scope>
    </dependency>
  </dependencies>
</dependencyManagement>
1、使用 Spring Cloud Config 配置服务
要在应用程序中启用 Spring Cloud Config 功能,首先要在项目依赖中加入 spring-cloud-config-server。
<dependency>
   <groupId>org.springframework.cloud</groupId>
   <artifactId>spring-cloud-config-server</artifactId>
</dependency>
然后使用 @EnableConfigServer 注解启用嵌入式配置服务器。
@SpringBootApplication
@EnableConfigServer
public class ConfigApplication {

   public static void main(String[] args) {
      new SpringApplicationBuilder(ConfigApplication.class).run(args);
   }

}
默认情况下,Spring Cloud Config Server 将配置数据存储在 Git 仓库中。我们将通过激活 native 模式来改变这种行为。在此模式下,Spring Cloud Config Server 会从 classpath 读取属性源。我们将所有 YAML property 文件放在 src/main/resources/config 中。下面是配置服务器 application.yml 文件。它激活了 native 模式,并将默认端口覆盖为 8088。
server:
  port: 8088
spring:
  profiles:
    active: native
YAML 文件名将与服务名称相同。例如,discovery-service 的 YAML 文件位于此处:src/main/resources/config/discovery-service.yml。除了默认 profile,我们还将定义自定义的 docker profile。因此,配置文件的名称将包含 docker 后缀。在默认 profile 中,通过 localhost 连接服务,并动态分配端口,如下:
server:
  port: 0

eureka:
  client:
    serviceUrl:
      defaultZone: http://localhost:8061/eureka/
以下是默认 profile 的典型配置:
server:
  port: 8080

eureka:
  client:
    serviceUrl:
      defaultZone: http://discovery-service:8061/eureka/
为了在客户端连接配置服务器,我们需要在 Maven 依赖中包含以下模块:
<dependency>
  <groupId>org.springframework.cloud</groupId>
  <artifactId>spring-cloud-starter-config</artifactId>
</dependency>
根据运行环境(localhost 或 docker)的不同,我们需要为配置服务器提供不同的地址:
application.yml
spring:
  config:
    import: "optional:configserver:http://config-service:8088"
    activate:
      on-profile: docker
---
spring:
  application:
    name: discovery-service
  config:
    import: "optional:configserver:http://localhost:8088"
2、使用 Spring Cloud Netflix Eureka 发现服务
当然,你也可以用 Spring Cloud 支持的任何其他发现服务代替 Eureka。如 Consul、Alibaba Nacos 或 Zookeeper。运行 Eureka 服务器的最佳方式是将其嵌入 Spring Boot 应用。为此,我们首先需要包含以下 Maven 依赖:
<dependency>
   <groupId>org.springframework.cloud</groupId>
   <artifactId>spring-cloud-starter-netflix-eureka-server</artifactId>
</dependency>
然后,我们需要在 main 类上设置 @EnableEurekaServer 注解。
@SpringBootApplication
@EnableEurekaServer
public class DiscoveryApplication {

   public static void main(String[] args) {
      new SpringApplicationBuilder(DiscoveryApplication.class).run(args);
   }

}
如前所述,配置文件 discovery-service.yml 或 discovery-service-docker.yml 应放在 config-service 模块内。我们已将 Eureka 的运行端口从默认值(8761)改为 8061。对于独立的 Eureka 实例,我们必须禁用注册并不从注册中心获取服务信息。我们只想激活一个单节点的演示版发现服务器(discovery server)。
server:
  port: 8061

eureka:
  instance:
    hostname: localhost
  client:
    registerWithEureka: false
    fetchRegistry: false
    serviceUrl:
      defaultZone: http://${eureka.instance.hostname}:${server.port}/eureka/
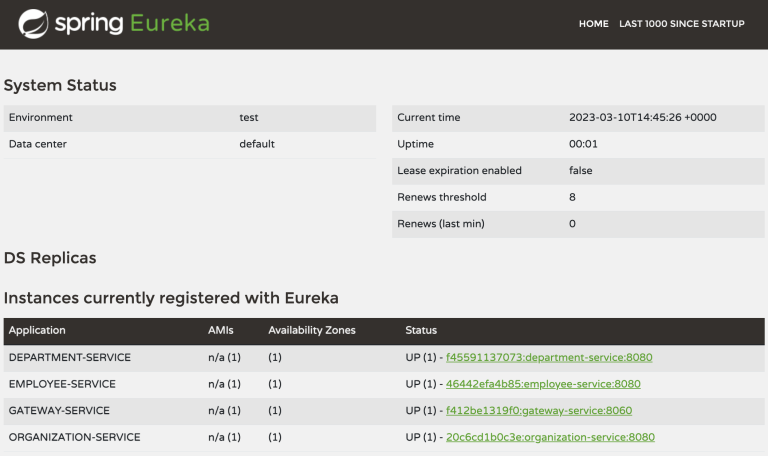
成功启动应用程序后,你可以访问 http://localhost:8061/ 地址下的 Eureka 控制面板。
3、使用 Spring Boot 3 和 Spring Cloud 开发应用
让我们来看看微服务所需的 Maven 模块列表。每个应用程序都必须从 config-service 获取配置,并在 discovery-service 中注册自己。它还会公开 REST API,自动生成 API 文档,并向 Zipkin 实例导出链路追踪信息。我们使用 Spring Boot 3 专用的 springdoc-openapi v2 库。它以 JSON 和 YAML 两种格式生成文档,可在 v3/api-docs 路径下获取(或 /v3/api-docs.yaml 用于 YAML 格式)。为了向 Zipkin 服务器导出链路追踪,我们将使用 opentelemetry-exporter-zipkin 模块。
<dependencies>
  <dependency>
    <groupId>org.springframework.cloud</groupId>
    <artifactId>spring-cloud-starter-netflix-eureka-client</artifactId>
  </dependency>
  <dependency>
    <groupId>org.springframework.cloud</groupId>
    <artifactId>spring-cloud-starter-config</artifactId>
  </dependency>
  <dependency>
    <groupId>org.springframework.boot</groupId>
    <artifactId>spring-boot-starter-web</artifactId>
  </dependency>
  <dependency>
    <groupId>org.springframework.boot</groupId>
    <artifactId>spring-boot-starter-actuator</artifactId>
  </dependency>
  <dependency>
    <groupId>io.micrometer</groupId>
    <artifactId>micrometer-tracing-bridge-otel</artifactId>
  </dependency>
  <dependency>
    <groupId>io.opentelemetry</groupId>
    <artifactId>opentelemetry-exporter-zipkin</artifactId>
  </dependency>
  <dependency>
    <groupId>org.springdoc</groupId>
    <artifactId>springdoc-openapi-starter-webmvc-api</artifactId>
    <version>2.0.2</version>
  </dependency>
</dependencies>
为了调用其他服务 API,我们还需要包含一个声明式 REST 客户端。我们将使用 Spring Cloud OpenFeign。
<dependency>
   <groupId>org.springframework.cloud</groupId>
   <artifactId>spring-cloud-starter-openfeign</artifactId>
</dependency>
OpenFeign 客户端会自动与服务发现集成。我们只需在 @FeingClient 注解中设置在 Eureka 中注册的服务名称即可。要创建客户端,我们需要定义一个接口,其中包含了客户端要调用的所有端点。
@FeignClient(name = "employee-service")
public interface EmployeeClient {

   @GetMapping("/organization/{organizationId}")
   List<Employee> findByOrganization(@PathVariable("organizationId") Long organizationId);

}
在演示过程中,我们将向 Zipkin 发送所有链路追踪。这需要将概率参数的值设置为 1.0。还需要使用 management.zipkin.tracing.endpoint 属性覆盖 Zipkin 的默认 URL。
management:
  tracing:
    sampling:
      probability: 1.0
  zipkin:
    tracing:
      endpoint: http://zipkin:9411/api/v2/spans
下面是 department-service 中 @RestController 的实现。它注入了与数据库交互的 repository Bean 和与 employee-service 通信的 Feign client Bean。其余代码非常简单。
@RestController
public class DepartmentController {

  private static final Logger LOGGER = LoggerFactory.getLogger(DepartmentController.class);

  DepartmentRepository repository;
  EmployeeClient employeeClient;

  public DepartmentController(DepartmentRepository repository, EmployeeClient employeeClient) {
    this.repository = repository;
    this.employeeClient = employeeClient;
  }

  @PostMapping("/")
  public Department add(@RequestBody Department department) {
    LOGGER.info("Department add: {}", department);
    return repository.add(department);
  }

  @GetMapping("/{id}")
  public Department findById(@PathVariable("id") Long id) {
    LOGGER.info("Department find: id={}", id);
    return repository.findById(id);
  }

  @GetMapping("/")
  public List<Department> findAll() {
    LOGGER.info("Department find");
    return repository.findAll();
  }

  @GetMapping("/organization/{organizationId}")
  public List<Department> findByOrganization(@PathVariable("organizationId") Long organizationId) {
    LOGGER.info("Department find: organizationId={}", organizationId);
    return repository.findByOrganization(organizationId);
  }

  @GetMapping("/organization/{organizationId}/with-employees")
  public List<Department> findByOrganizationWithEmployees(@PathVariable("organizationId") Long organizationId) {
    LOGGER.info("Department find: organizationId={}", organizationId);
    List<Department> departments = repository.findByOrganization(organizationId);
    departments.forEach(d -> d.setEmployees(employeeClient.findByDepartment(d.getId())));
    return departments;
  }

}
如你所见,Spring Boot 2 和 Spring Boot 3 在应用实现方面几乎没有区别。你唯一需要做的就是将所有 javax.persistence 更改为 jakarta.persistance。
4、使用 Spring Cloud Gateway 作为网关
gateway-service 是 Spring Boot 3 微服务架构中的最后一个应用程序。从 Spring Boot 2 开始,Spring Cloud Gateway 取代了 Netflix Zuul。我们还可以使用 VMWare Tanzu 提供的 Helm chart 等将其安装在 Kubernetes 上。
我们将创建一个嵌入式网关的独立应用。为此,我们需要在 Maven 依赖中包含 Spring Cloud Gateway Starter。由于我们的网关必须与发现、配置服务交互,因此它还包括 Eureka Client Starter 和 Spring Cloud Config Starter。我们不希望将它仅仅用作下游服务的代理,而且我们还要公开所有应用程序生成的 OpenAPI 文档。由于 Spring Cloud Gateway 是在 Spring WebFlux 的基础上构建的,因此我们需要包含专用于该项目的 Springdoc Starter。
<dependency>
   <groupId>org.springframework.cloud</groupId>
   <artifactId>spring-cloud-starter-gateway</artifactId>
</dependency>
<dependency>
  <groupId>org.springframework.cloud</groupId>
  <artifactId>spring-cloud-starter-netflix-eureka-client</artifactId>
</dependency>
<dependency>
  <groupId>org.springframework.cloud</groupId>
  <artifactId>spring-cloud-starter-config</artifactId>
</dependency>
<dependency>
  <groupId>io.micrometer</groupId>
  <artifactId>micrometer-tracing-bridge-otel</artifactId>
</dependency>
<dependency>
  <groupId>io.opentelemetry</groupId>
<artifactId>opentelemetry-exporter-zipkin</artifactId>
</dependency>
<dependency>
  <groupId>org.springdoc</groupId>
  <artifactId>springdoc-openapi-starter-webflux-api</artifactId>
  <version>2.0.2</version>
</dependency>
<dependency>
  <groupId>org.springdoc</groupId>
  <artifactId>springdoc-openapi-starter-webflux-ui</artifactId>
  <version>2.0.2</version>
</dependency>
为了从多个 v3/api-docs 端点公开 OpenAPI 文档,我们需要使用 GroupedOpenApi 对象。它应该提供一种在 employee-service、department-service 和 organization-service 生成的文档之间进行切换的方法。这些服务在动态地址(或至少是随机端口)上运行。在这种情况下,我们将使用 RouteDefinitionLocator Bean 获取每个服务的当前 URL。然后,我们只需过滤路由列表,找到与我们的三个微服务相关的路由。最后,我们创建包含服务名称和路径的 GroupedOpenApi。
@SpringBootApplication
public class GatewayApplication {

   private static final Logger LOGGER = LoggerFactory
      .getLogger(GatewayApplication.class);

   public static void main(String[] args) {
      SpringApplication.run(GatewayApplication.class, args);
   }

   @Autowired
   RouteDefinitionLocator locator;

   @Bean
   public List<GroupedOpenApi> apis() {
      List<GroupedOpenApi> groups = new ArrayList<>();
      List<RouteDefinition> definitions = locator
         .getRouteDefinitions().collectList().block();
      assert definitions != null;
      definitions.stream().filter(routeDefinition -> routeDefinition
         .getId()
         .matches(".*-service"))
         .forEach(routeDefinition -> {
            String name = routeDefinition.getId()
               .replaceAll("-service", "");
            groups.add(GroupedOpenApi.builder()
               .pathsToMatch("/" + name + "/**").group(name).build());
         });
      return groups;
   }

}
下面是 gateway-service 的配置。我们应将 spring.cloud.gateway.discovery.locator.enabled 属性设置为 true,以启用与发现服务的整合。然后,我们可以继续定义路由规则。我们使用 Path Route Predicate Factory 来匹配传入的请求,并使用 RewritePath GatewayFilter Factory 来修改请求的路径,使其适应下游服务公开的路由模式。uri 参数指定在发现服务中注册的目标服务名称。
例如,在谓词(Predicate) Path=/organization/** 成功匹配路由后,由 RewritePath Filter 把 请求 URL 从 /organization/** 改写到为了 /**,因此 organization-service 可以通过网关的 /organization/** 路由访问。
application.yml
spring:
  output:
    ansi:
      enabled: always
  cloud:
    gateway:
      discovery:
        locator:
          enabled: true
      routes:
      - id: employee-service
        uri: lb://employee-service
        predicates:
        - Path=/employee/**
        filters:
        - RewritePath=/employee/(?<path>.*), /$\{path}
      - id: department-service
        uri: lb://department-service
        predicates:
        - Path=/department/**
        filters:
        - RewritePath=/department/(?<path>.*), /$\{path}
      - id: organization-service
        uri: lb://organization-service
        predicates:
        - Path=/organization/**
        filters:
        - RewritePath=/organization/(?<path>.*), /$\{path}
      - id: openapi
        uri: http://localhost:${server.port}
        predicates:
        - Path=/v3/api-docs/**
        filters:
        - RewritePath=/v3/api-docs/(?<path>.*), /$\{path}/v3/api-docs

springdoc:
  swagger-ui:
    urls:
      - name: employee
        url: /v3/api-docs/employee
      - name: department
        url: /v3/api-docs/department
      - name: organization
        url: /v3/api-docs/organization
如上所示,我们还为 Springdoc OpenAPI 创建了一个专用路由。它会重写路径,将 /v3/api-docs 上下文正确地提供给Swagger UI。
5、运行 Spring Boot 3 微服务
最后,我们就可以运行所有微服务了,可以直接在电脑上或使用 Docker 容器启动它们。
方案 1:直接在电脑上启动
我们总共要运行 6 个应用程序: 3 个微服务、一个发现服务、一个配置服务和一个网关。我们还需要运行 Zipkin 来收集和存储服务间的通信链路追踪。第一步,我们应该启动 config-service。为此,我们可以使用 Spring Boot Maven 插件。只需进入 config-service 目录并执行以下命令即可。它暴露在 8088 端口上。
$ mvn spring-boot:run
我们应该对所有其他应用程序重复同样的步骤。discovery-service 监听 8061 端口,而 gateway-service 监听 8060 端口。由于配置中的 server.port=0 属性,微服务将在动态生成的端口号上启动。最后,我们可以使用 Zipkin 的 Docker 容器运行 Zipkin,命令如下:
$ docker run -d --name zipkin -p 9411:9411 openzipkin/zipkin
方案 2:使用 Docker Compose 构建镜像并运行
第一步,我们将构建整个 Maven 项目和所有应用程序的 Docker 镜像。我创建了一个 profile build-image,需要激活后才能构建镜像。它主要使用 Spring Boot Maven 插件提供的 build-image 步骤。不过,对于 config-service 和 discovery-service,我使用的是 Jib,因为它是在安装了 curl 的基础镜像之上构建的。对于这两个服务,Docker compose 需要在启动其他容器之前验证健康检查。
$ mvn clean package -Pbuild-image
docker-compose.yml 在 repository 根目录下。整个文件如下所示。我们需要在所有其他应用程序之前运行 config-service,因为它提供了属性源。其次,我们应该启动 discovery-service。在这两种情况下,我们都要定义健康检查,使用容器内的 curl 测试 HTTP 端点。启动并验证 config-service 和 discovery-service 后,我们就可以运行 gateway-service 和所有微服务了。由于使用了 SPRING_PROFILES_ACTIVE 环境变量,所有应用程序在运行时都激活了 docker Spring profile。它与配置属性中定义的 spring.profiles.active 参数相对应。
docker-composer.yml
version: "3.7"
services:
  zipkin:
    container_name: zipkin
    image: openzipkin/zipkin
    ports:
      - "9411:9411"
  config-service:
    image: piomin/config-service:1.1-SNAPSHOT
    ports:
      - "8088:8088"
    healthcheck:
      test: curl --fail http://localhost:8088/employee/docker || exit 1
      interval: 5s
      timeout: 2s
      retries: 3
  discovery-service:
    image: piomin/discovery-service:1.1-SNAPSHOT
    ports:
      - "8061:8061"
    depends_on:
      config-service:
        condition: service_healthy
    links:
      - config-service
    healthcheck:
      test: curl --fail http://localhost:8061/eureka/v2/apps || exit 1
      interval: 4s
      timeout: 2s
      retries: 3
    environment:
      SPRING_PROFILES_ACTIVE: docker
  employee-service:
    image: piomin/employee-service:1.2-SNAPSHOT
    ports:
      - "8080"
    depends_on:
      discovery-service:
        condition: service_healthy
    links:
      - config-service
      - discovery-service
      - zipkin
    environment:
      SPRING_PROFILES_ACTIVE: docker
  department-service:
    image: piomin/department-service:1.2-SNAPSHOT
    ports:
      - "8080"
    depends_on:
      discovery-service:
        condition: service_healthy
    links:
      - config-service
      - discovery-service
      - employee-service
      - zipkin
    environment:
      SPRING_PROFILES_ACTIVE: docker
  organization-service:
    image: piomin/organization-service:1.2-SNAPSHOT
    ports:
      - "8080"
    depends_on:
      discovery-service:
        condition: service_healthy
    links:
      - config-service
      - discovery-service
      - employee-service
      - department-service
      - zipkin
    environment:
      SPRING_PROFILES_ACTIVE: docker
  gateway-service:
    image: piomin/gateway-service:1.1-SNAPSHOT
    ports:
      - "8060:8060"
    depends_on:
      discovery-service:
        condition: service_healthy
    environment:
      SPRING_PROFILES_ACTIVE: docker
    links:
      - config-service
      - discovery-service
      - employee-service
      - department-service
      - organization-service
      - zipkin
最后,让我们使用 Docker Compose 运行所有应用:
$ docker-compose up
测试
启动所有应用程序后,就可以通过 gateway-service 对服务执行一些测试调用。它通过 8060 端口监听。启动过程中会自动生成一些测试数据。你可以调用以下端点来测试所有服务和它们之间的通信:
$ curl http://localhost:8060/employee/
$ curl http://localhost:8060/department/organization/1
$ curl http://localhost:8060/department/organization/1/with-employees
$ curl http://localhost:8060/organization/
$ curl http://localhost:8060/organization/1/with-departments
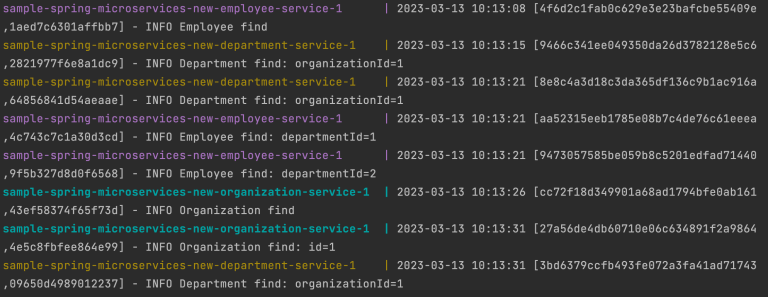
以下是应用程序在上述通信过程中生成的日志:
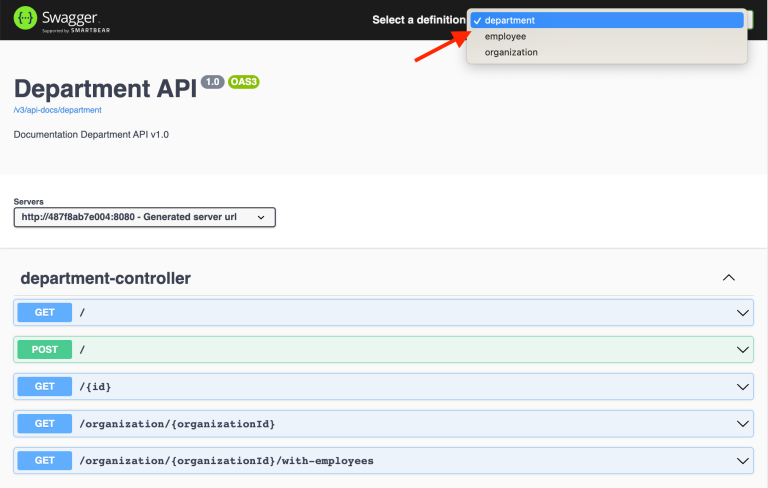
让我们在网关上显示 Swagger UI。如下所示,你可以在三个微服务的 context 之间轻松切换:
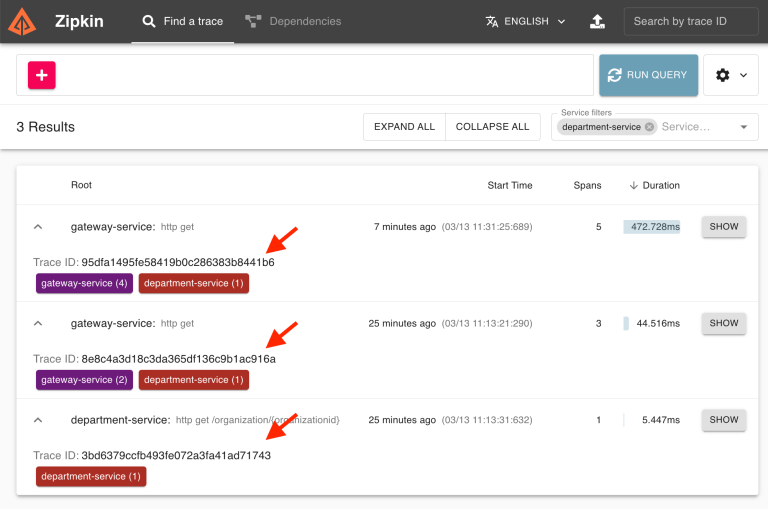
我们可以进入 Zipkin 面板来验证收集到的链路追踪:
总结
本文是 Spring Boot 3 微服务相关最常见组件的快速指南。
参考:https://piotrminkowski.com/2023/03/13/microservices-with-spring-boot-3-and-spring-cloud/